Gold Water: Landscapes of Olive and Olive Oil
A collaboration between the 5th Istanbul Design Biennial and e-flux Architecture, the Critical Cooking Show is a digital programme of films, lectures and performances that reimagine the kitchen as a space central to design thinking and production. I was commissioned by Mutfak مطبخ Workshop and Istanbul Design Biennial to create a number of information graphics on olive and olive oil produce in Turkey, Syria, and across the Mediterranean for one of the videos, Gold Water: Landscapes of Olive and Olive Oil.
Gold Water introduces the significance of olive trees and its produce in the archaeology, ecology, landscape, daily life, and politics of Mesopotamia. The episode starts in the kitchen of a Mutfak مطبخ Workshop member, and transitions to olive tree gardens in Kilis and İdlib, Oylum Höyük Archaeological Site, and Museum of Archaeology in Gaziantep, while interviewing farmers and other experts at different sites.
I joined the project when the video was almost finished so we didn’t have a lot of time and flexibility for research and concept development, but after a few meetings I was able to propose some ways in which data graphics can support the narrative.
Working for Gold Water was great fun, probably because it had many challenges:
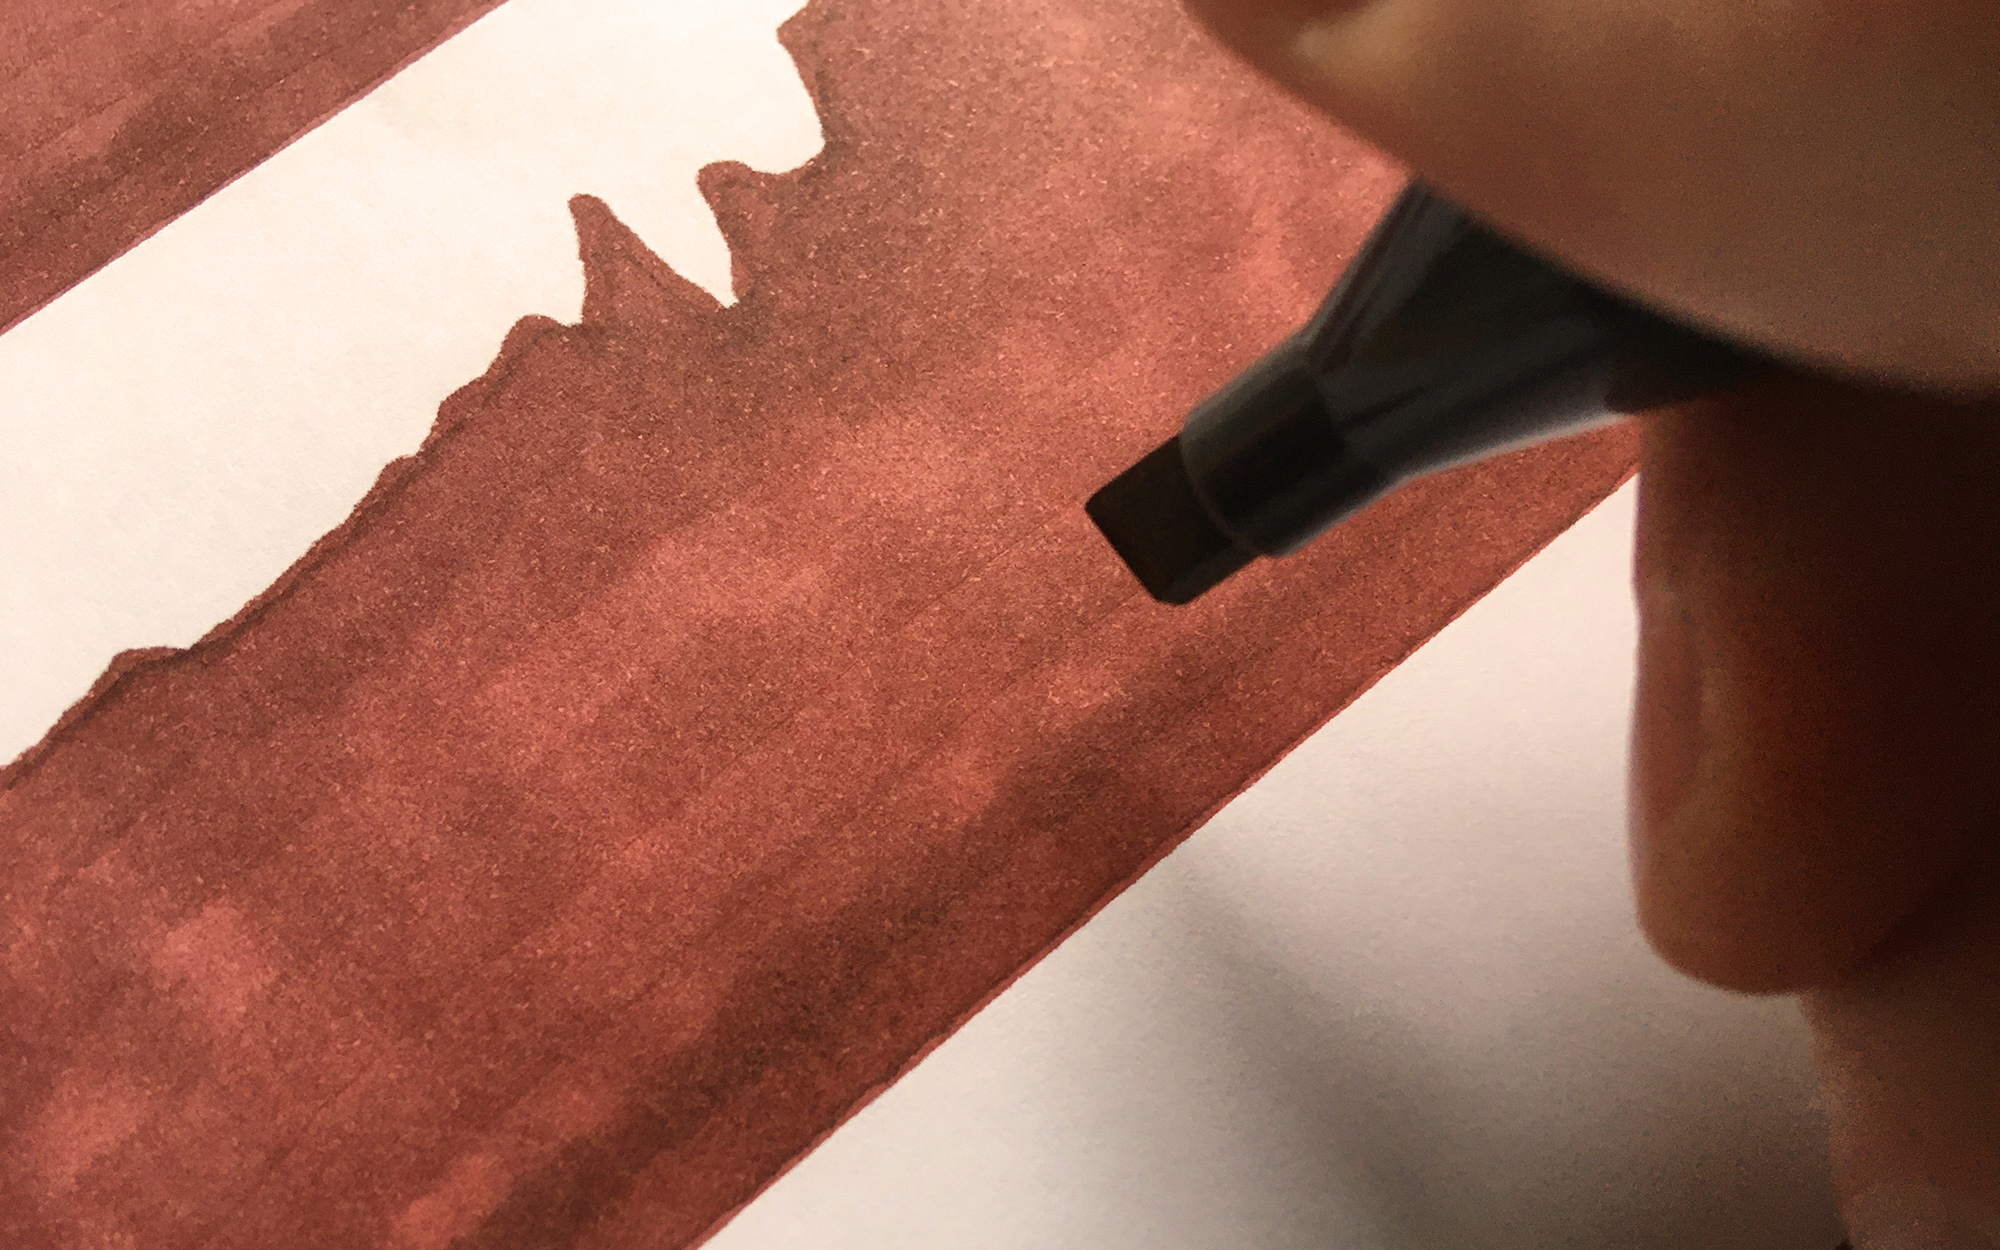
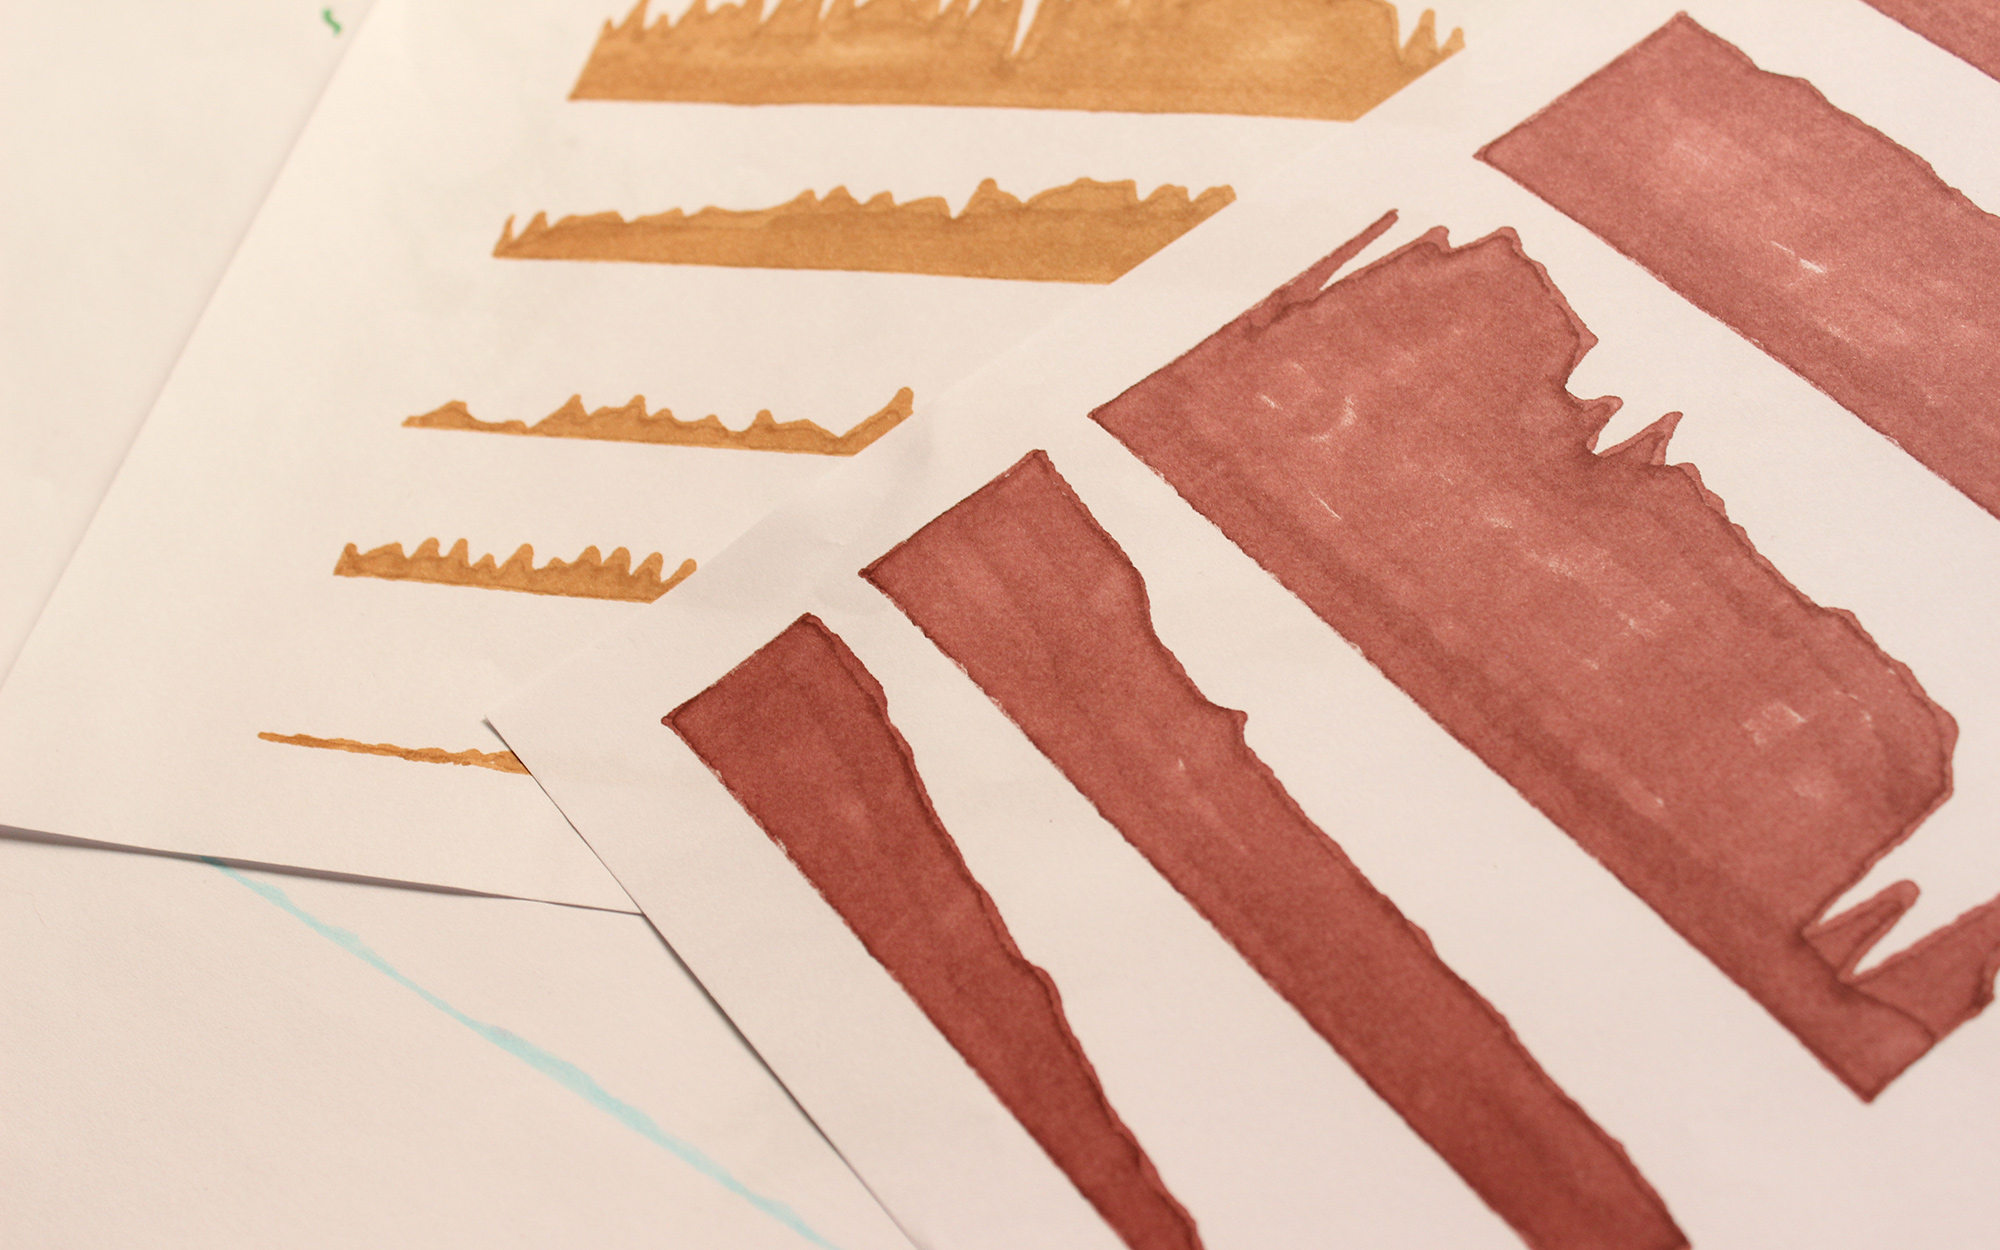
- In order to communicate with the rustic theme of the video, both in terms of its subject and its visual texture, I chose to partly reproduce the graphics by hand after they were finalized in the computer. This decision, made right after I first watched the video at the beginning of the process, has created some constraints for the kinds of visualizations to be used, and influenced many other choices along the way.
- The video medium was a challenge by itself for an information designer like me who usually works for static media, in terms of the ways it is experienced by the viewer: size, duration, control, etc. I made many decisions differently than I normally do: less complexity, less text, bigger point sizes, etc.
- Finally, we had three languages we wanted to display on the graphics: English, Turkish, and Arabic which I don’t speak and had no experience with as a typographer.
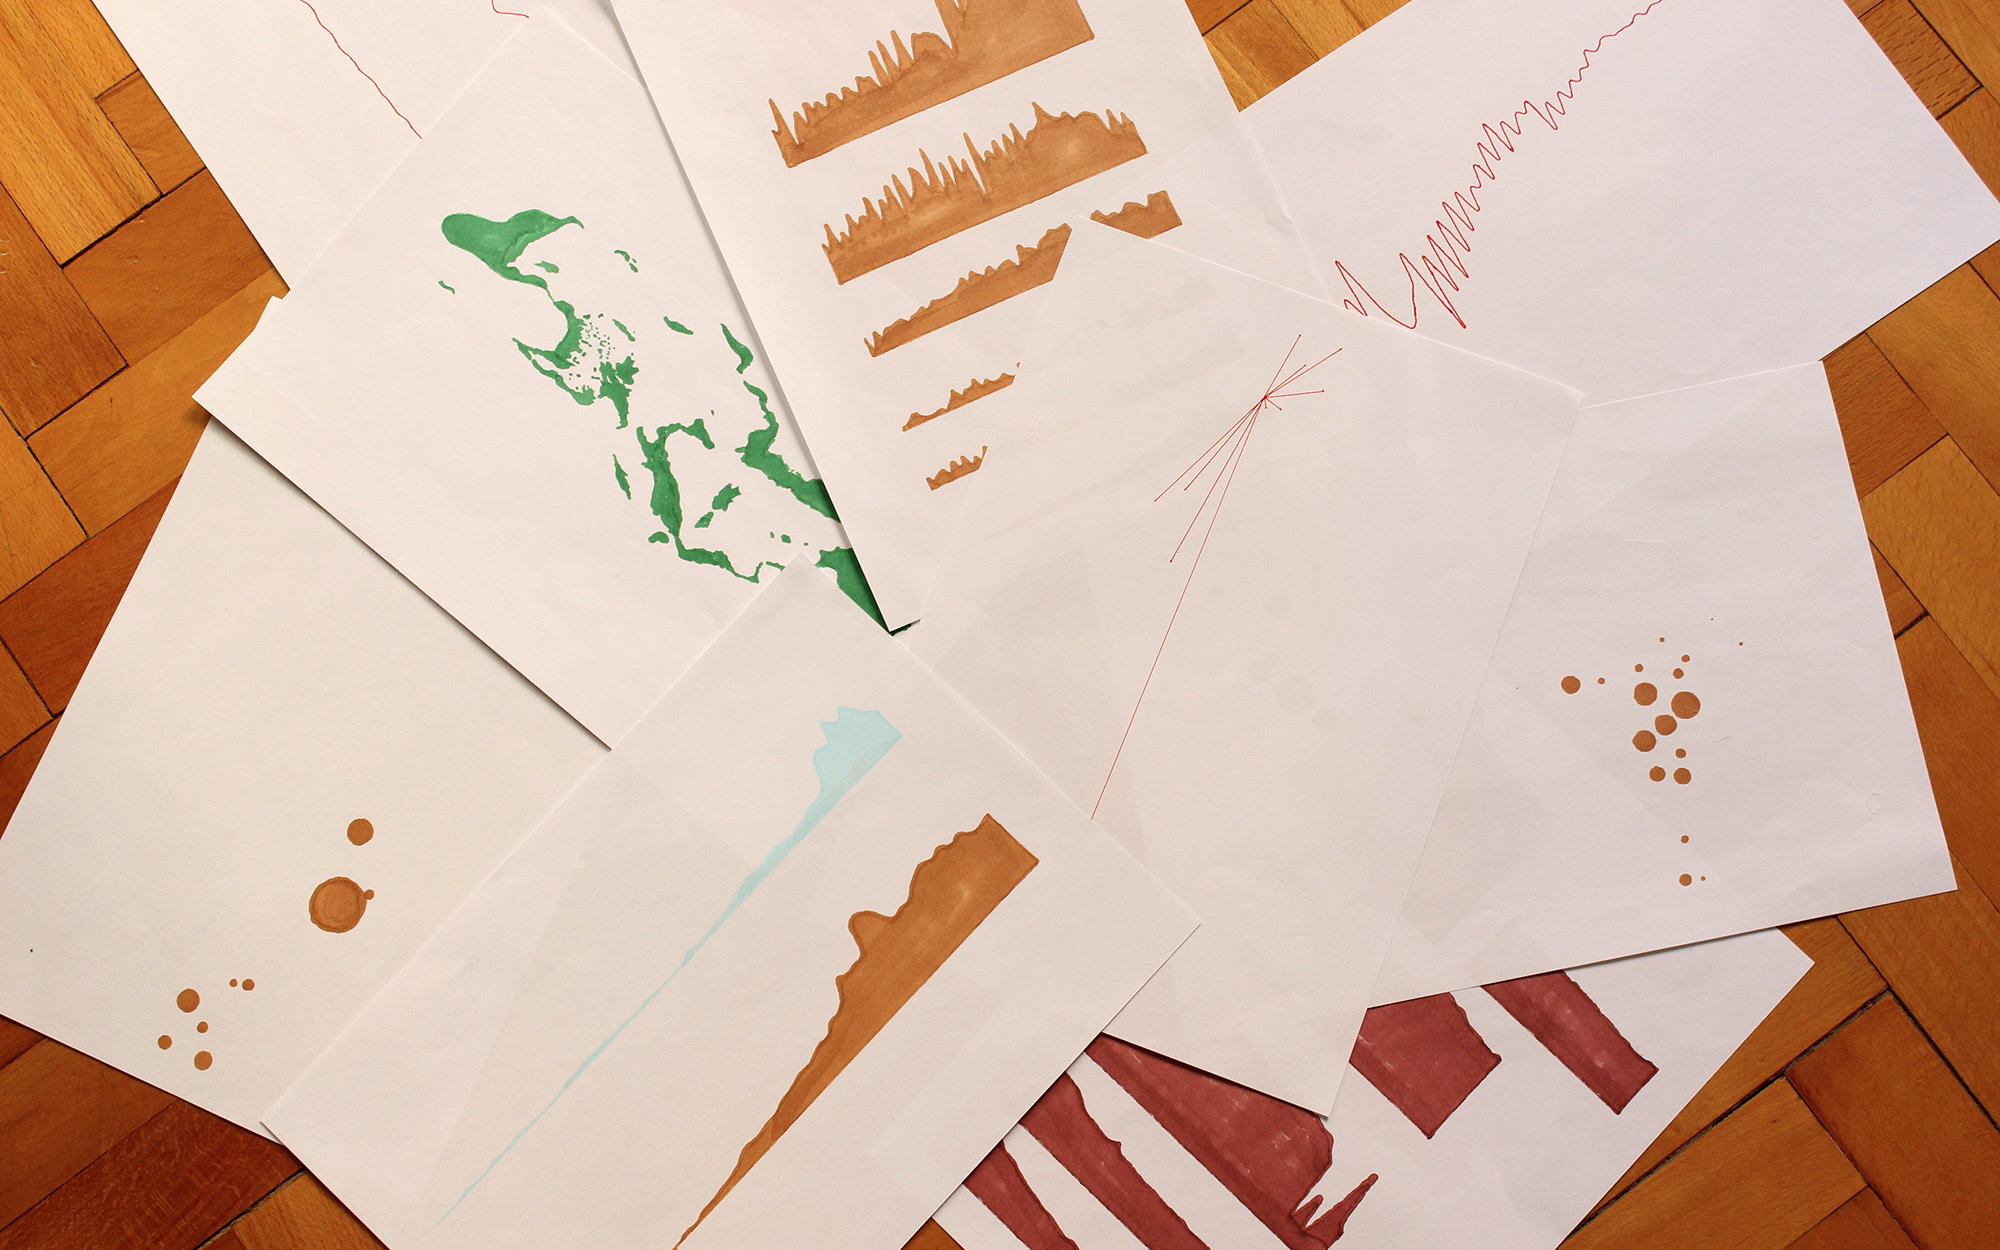
In the end, I’m quite happy with where these challenges have led us, especially with the graphic language that emerged.
In addition to being a process-output documentation, this post contains some explanations we wanted/needed to add to the graphics but couldn’t because of the medium and biennial format constraints. (Reminder: These graphics are better understood along with the commentaries in the video.)
—
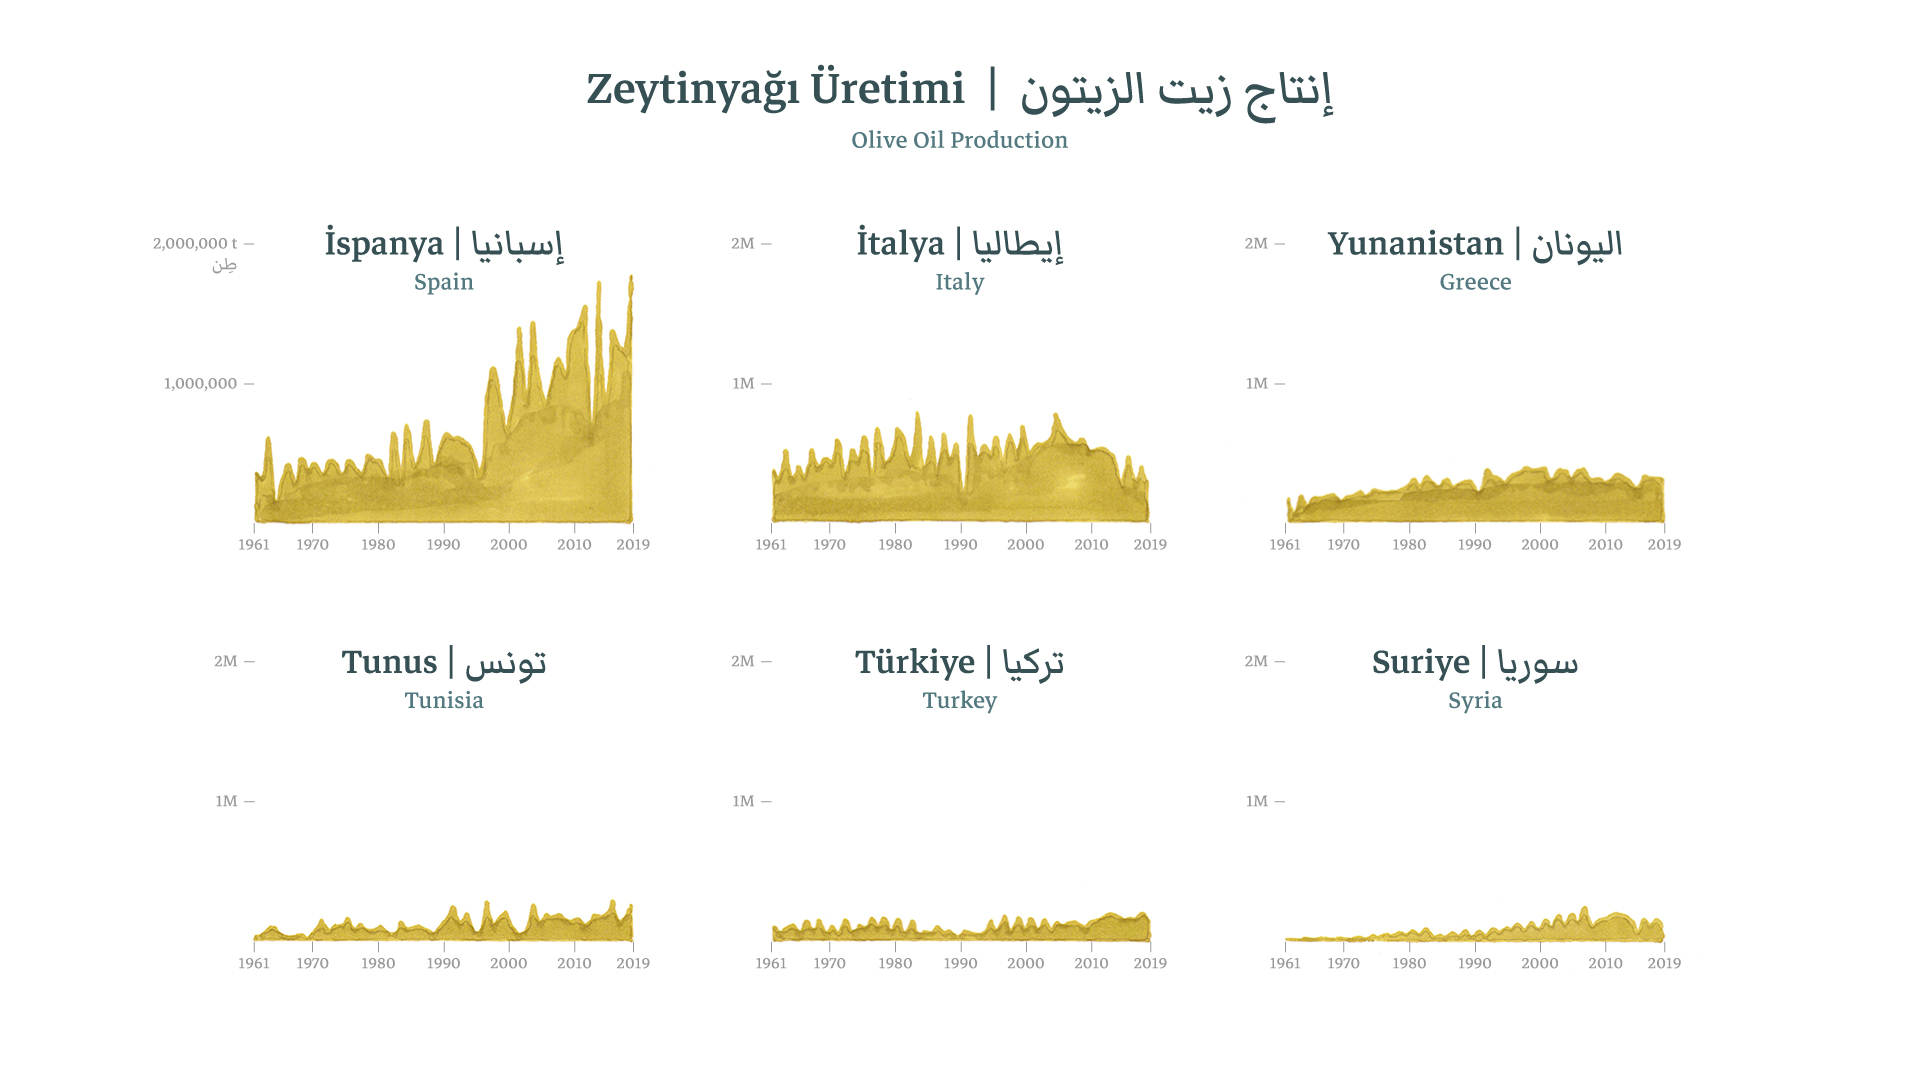
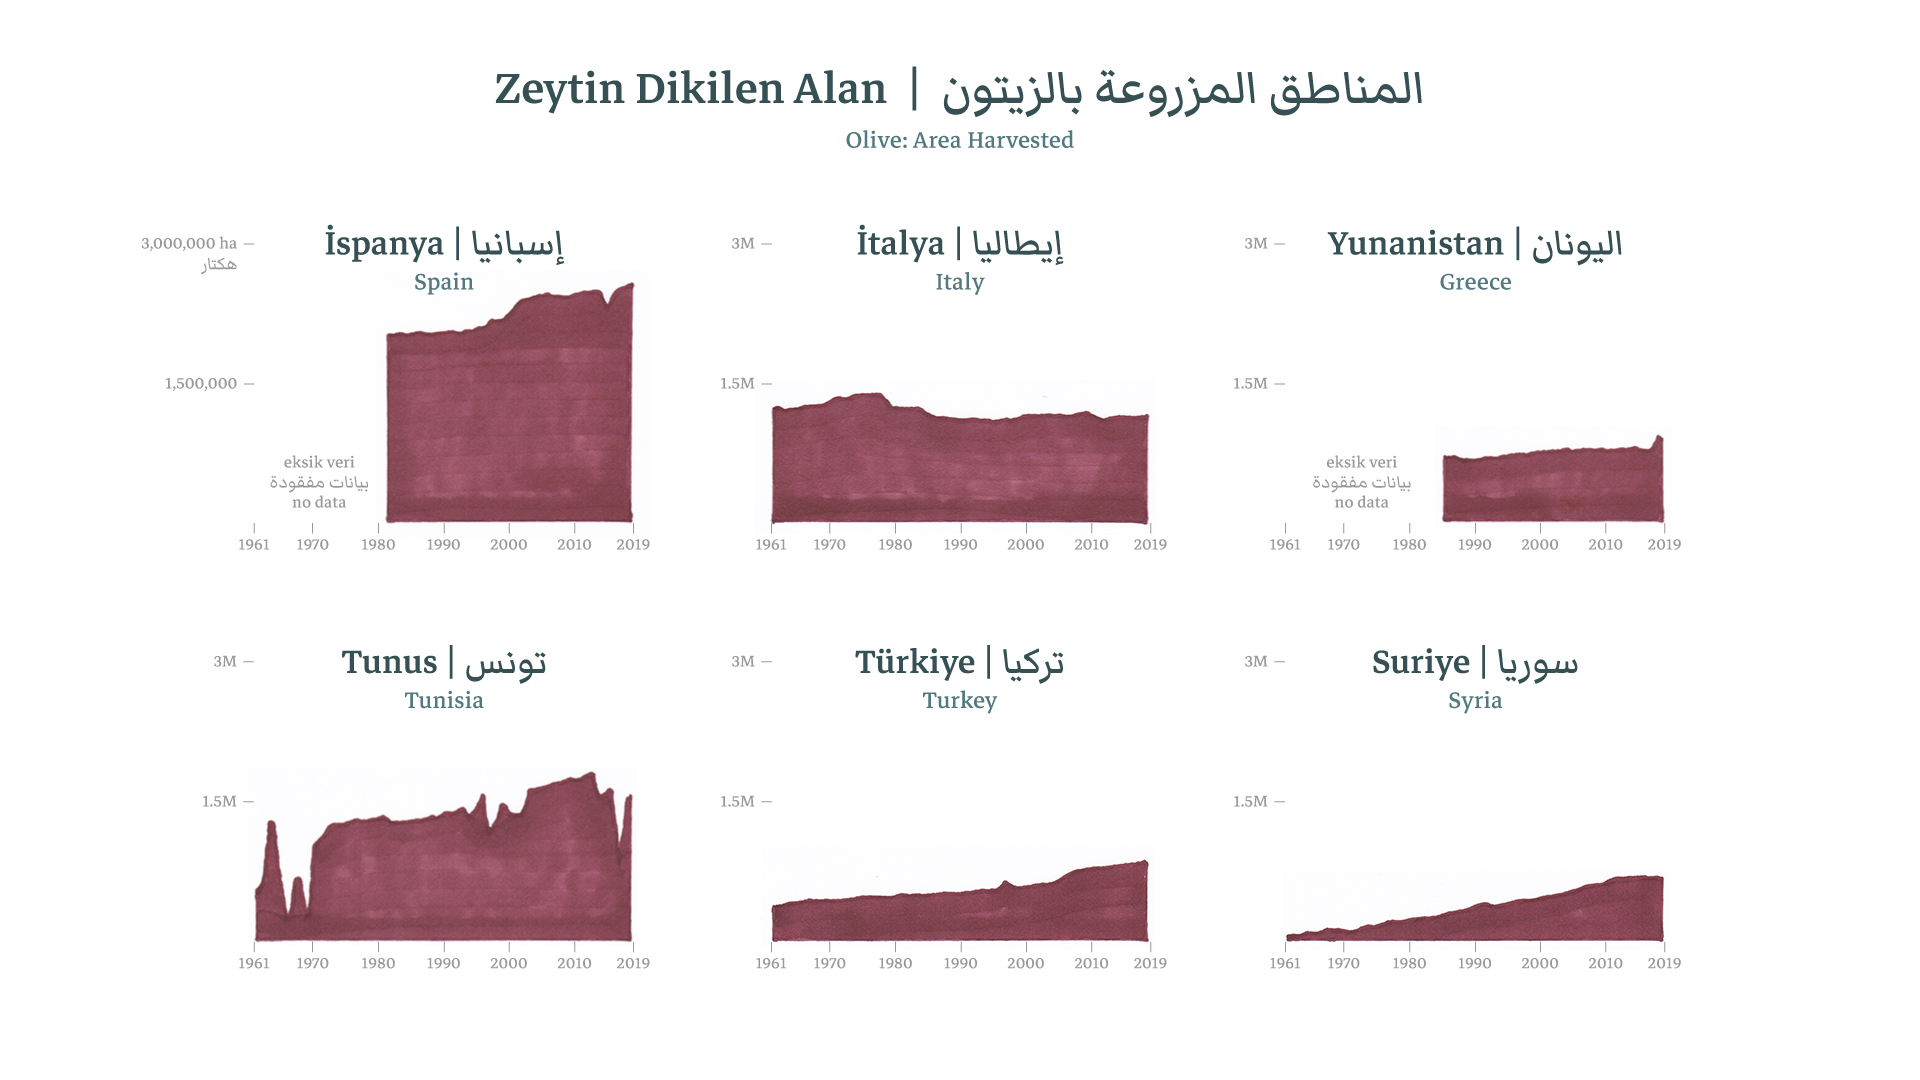
First, we wanted to show six of the main players in the olive oil market with their production and harvested area size1 in order to give an idea of Turkey’s and Syria’s positions globally.
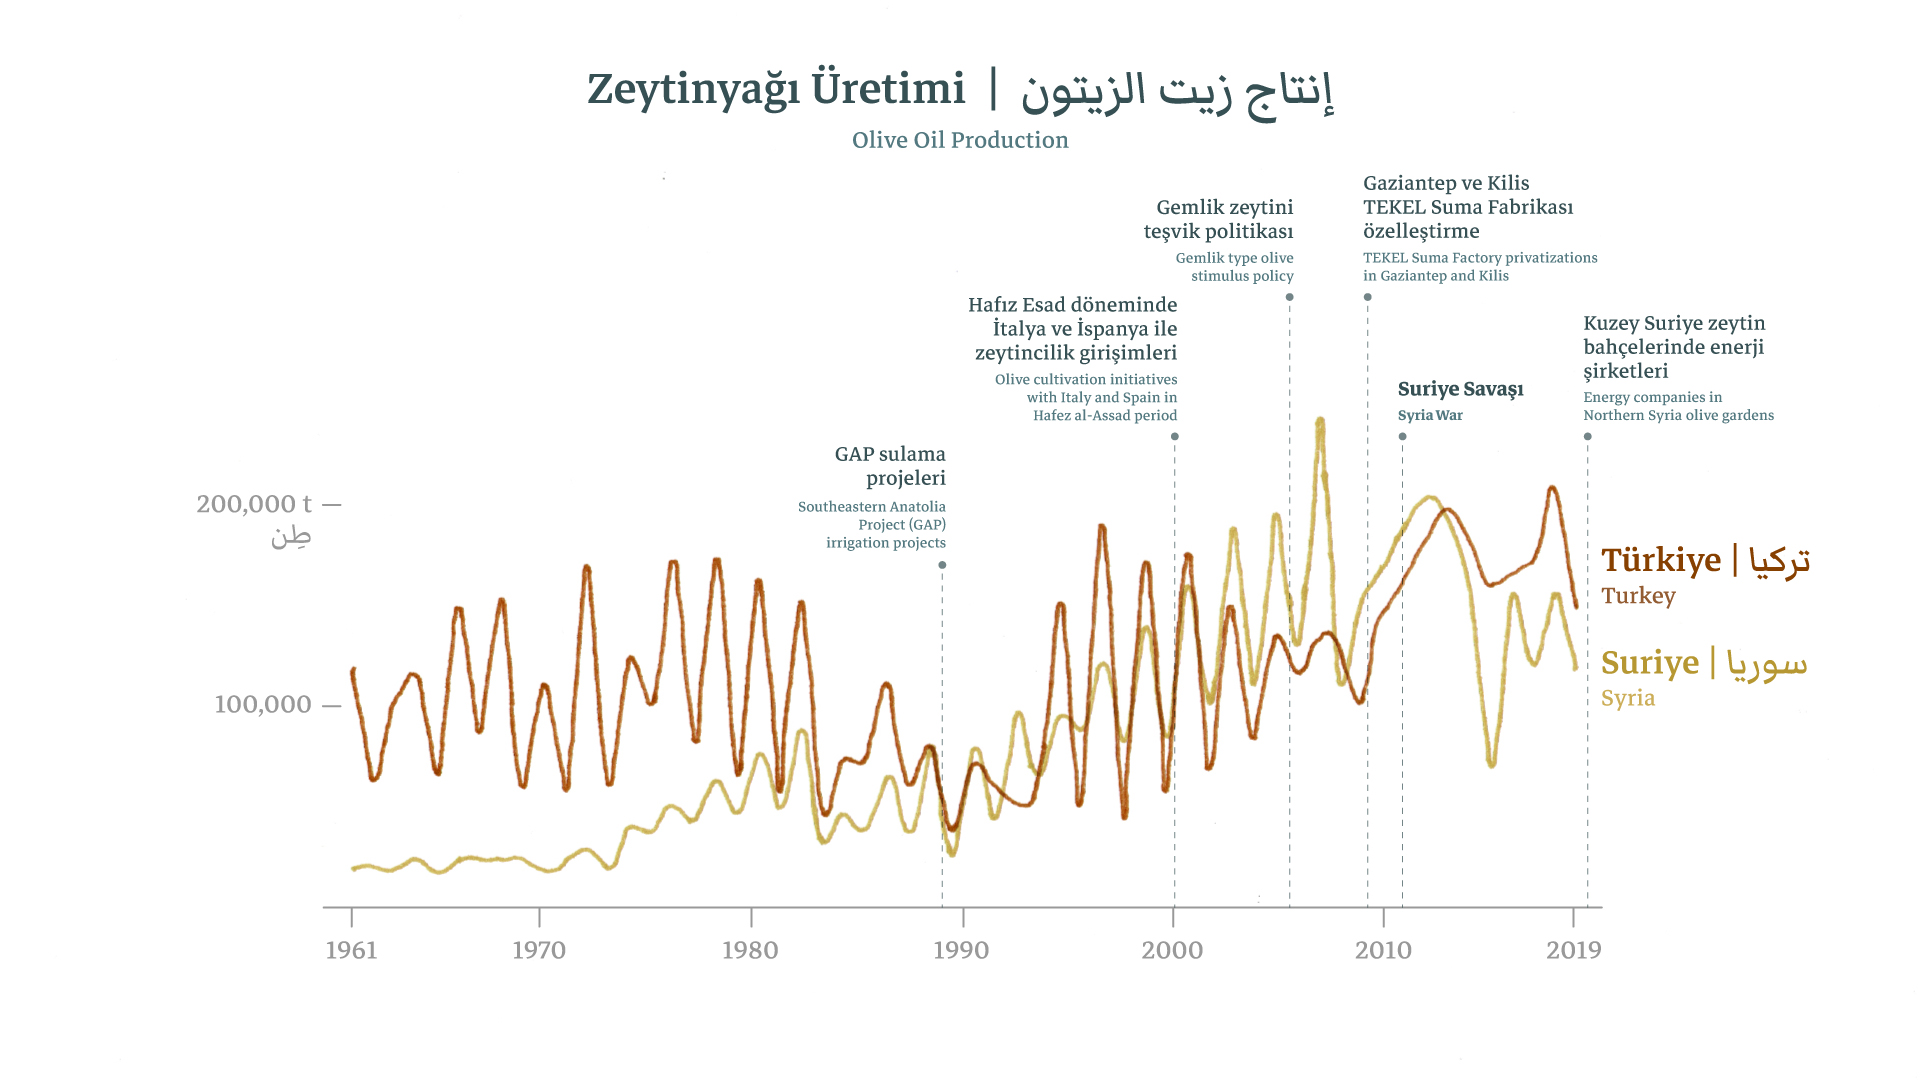
Then we zoomed in Turkey’s and Syria’s production graphics and annotated some milestone events. We don’t claim to know the exact nature of the relationships of these milestones with the line graphs, although these events are all important thresholds to focus further into. (The biennial up and downs in olive oil produce are the result of alternate bearing – a limitation which has been overcome in recent years to some degree.) (The 3-language system wasn’t working with this much text; the Arabic version is here.)
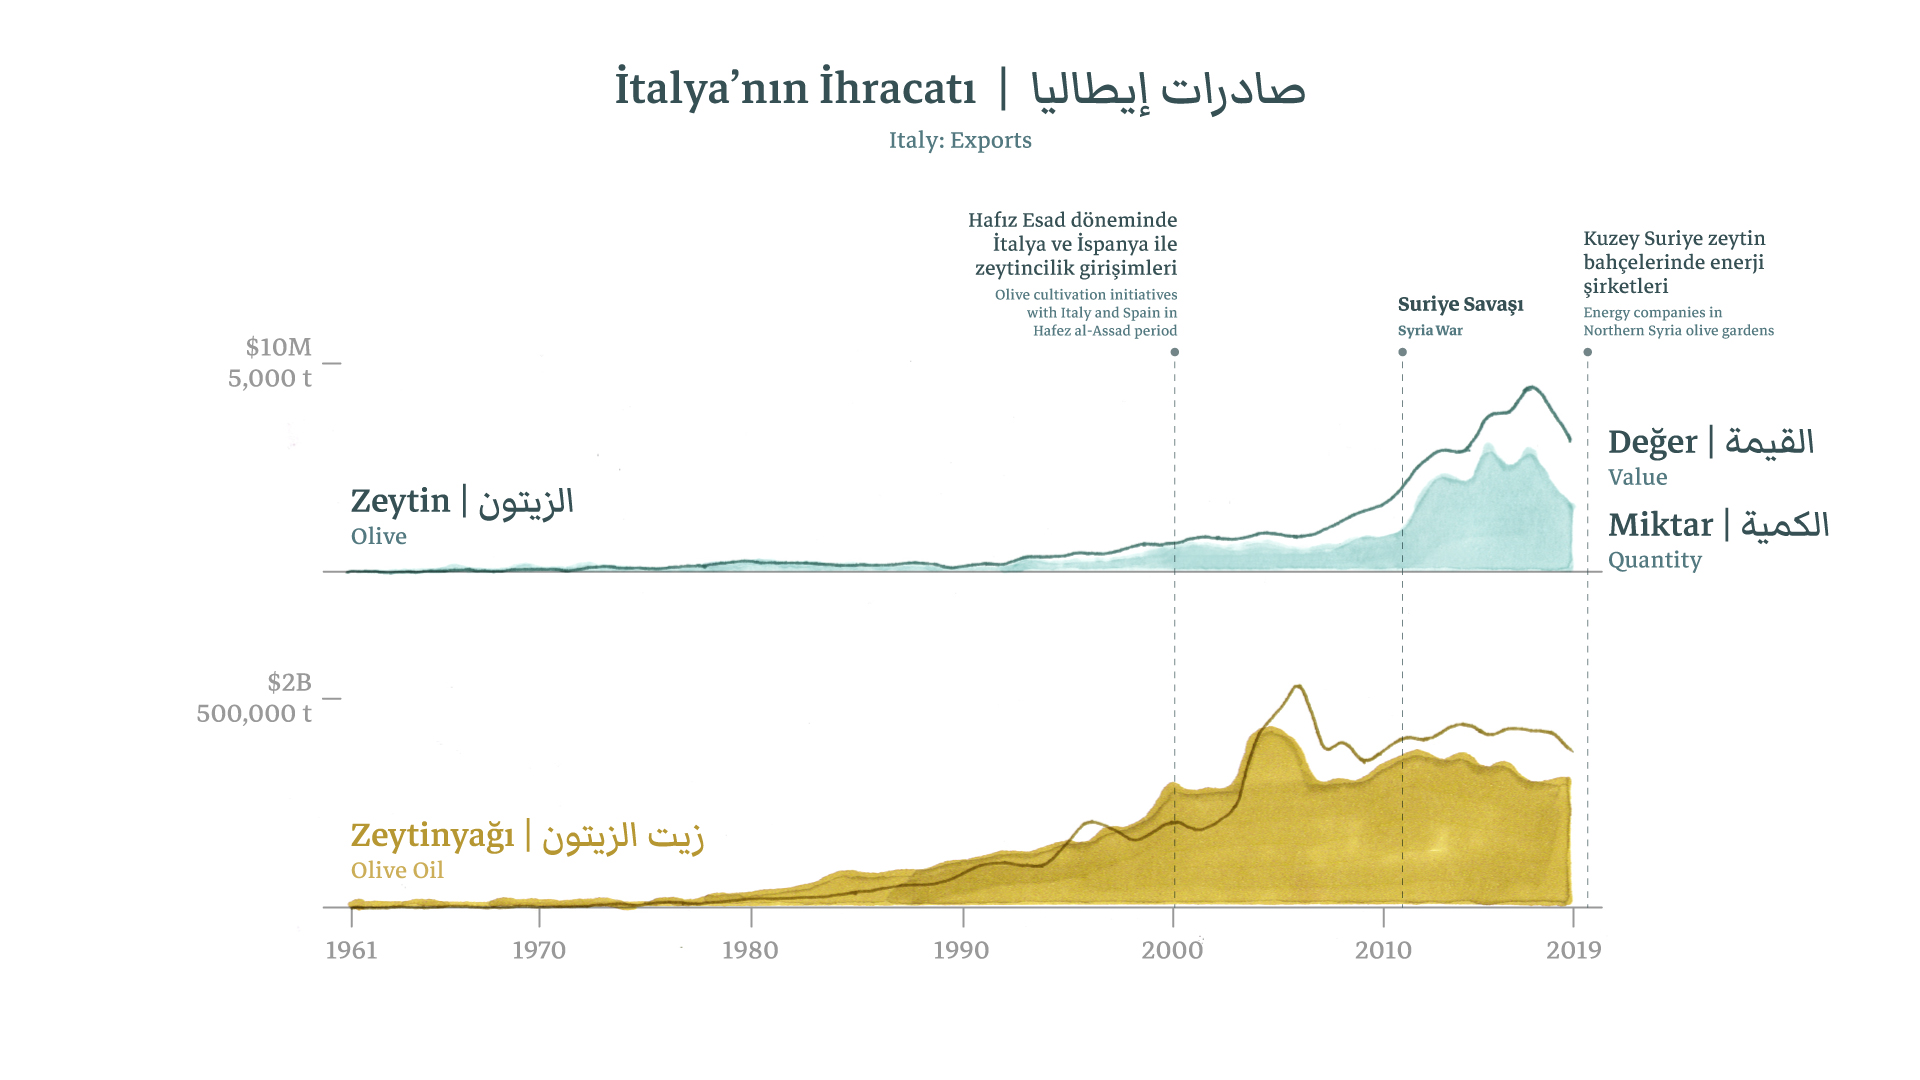
In Gold Water, one interviewee cites the reliably reported information about Italian companies buying olive oil from countries like Tunisia, Morocco, Turkey, and Syria and selling it at higher prices by labeling them as Italian. So we prepared a graphic showing Italy’s export numbers1 along with some of the milestones about Syria. Again, we don’t exactly know how much of the mischief involves olives/oil from Syria and/or Turkey in particular, but it is one part of the larger phenomenon that many people working in the sector confirm. (The Arabic version is here.)
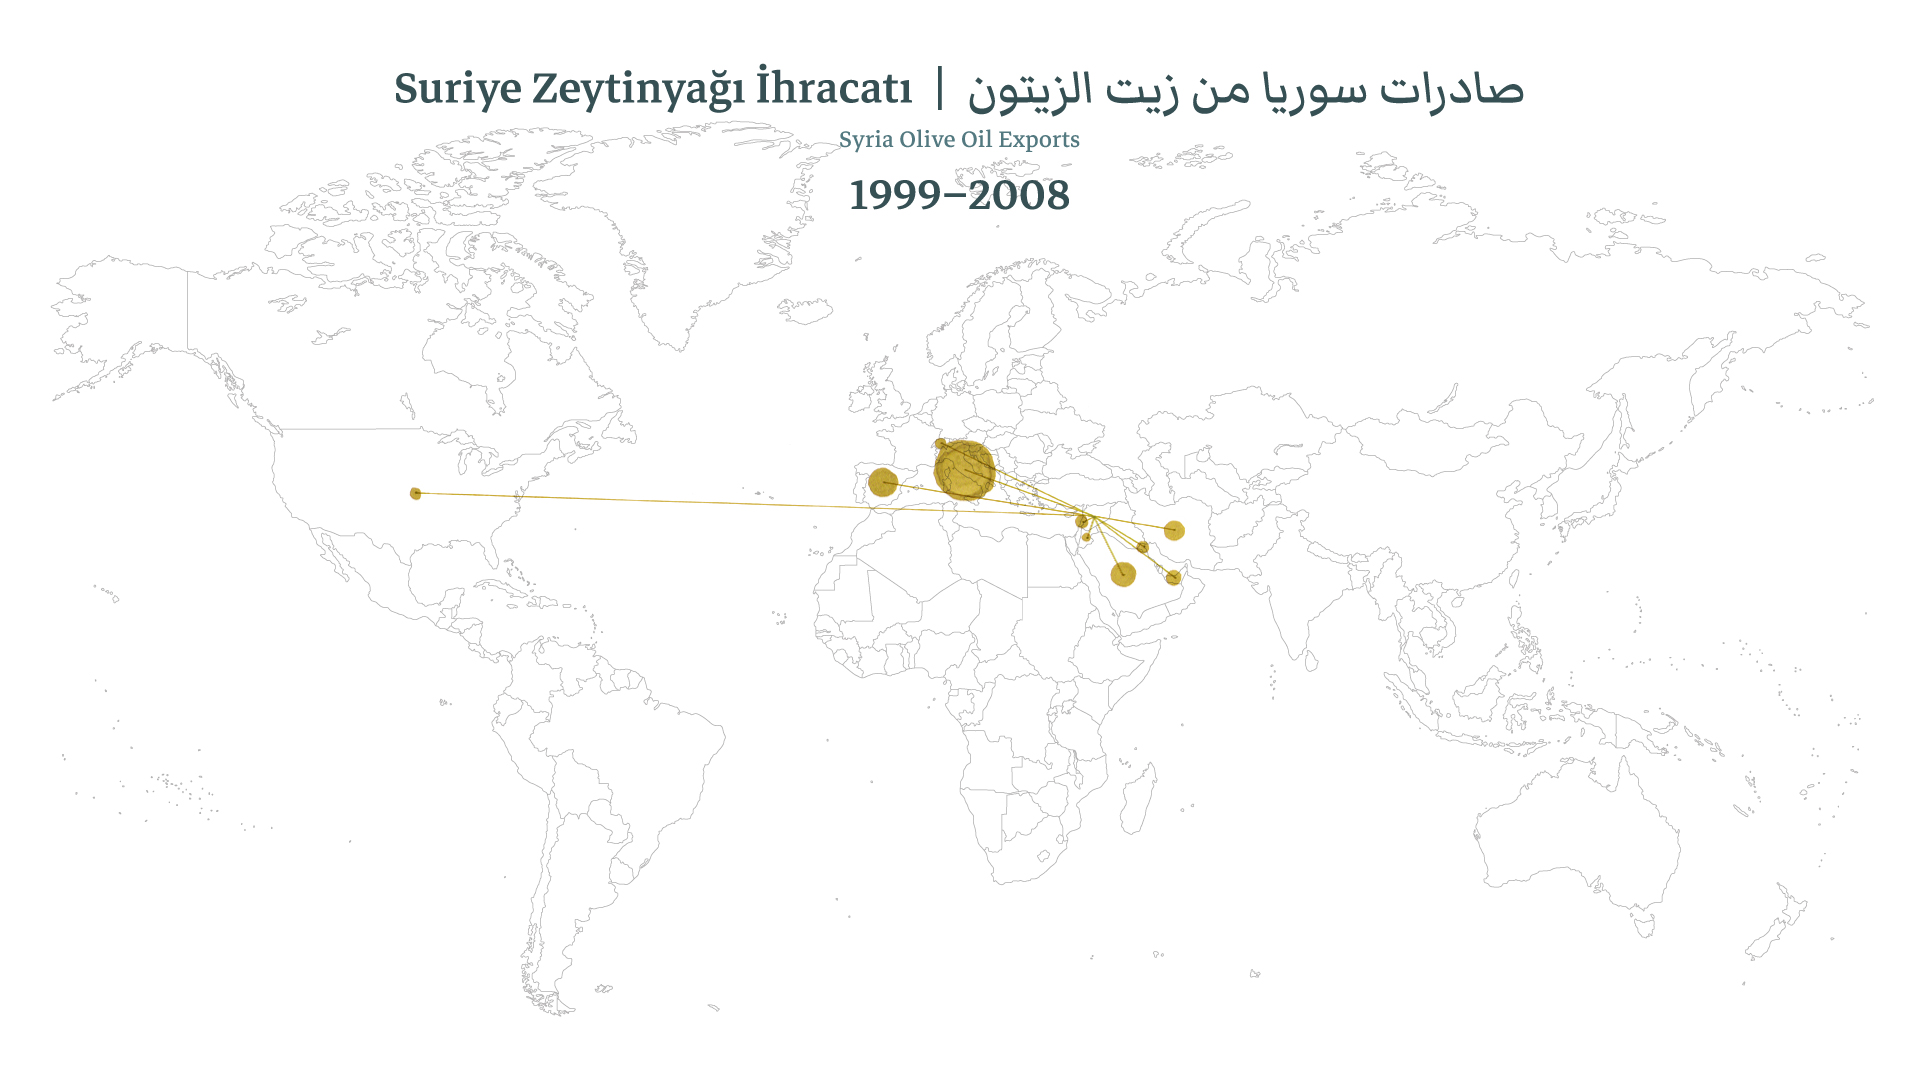
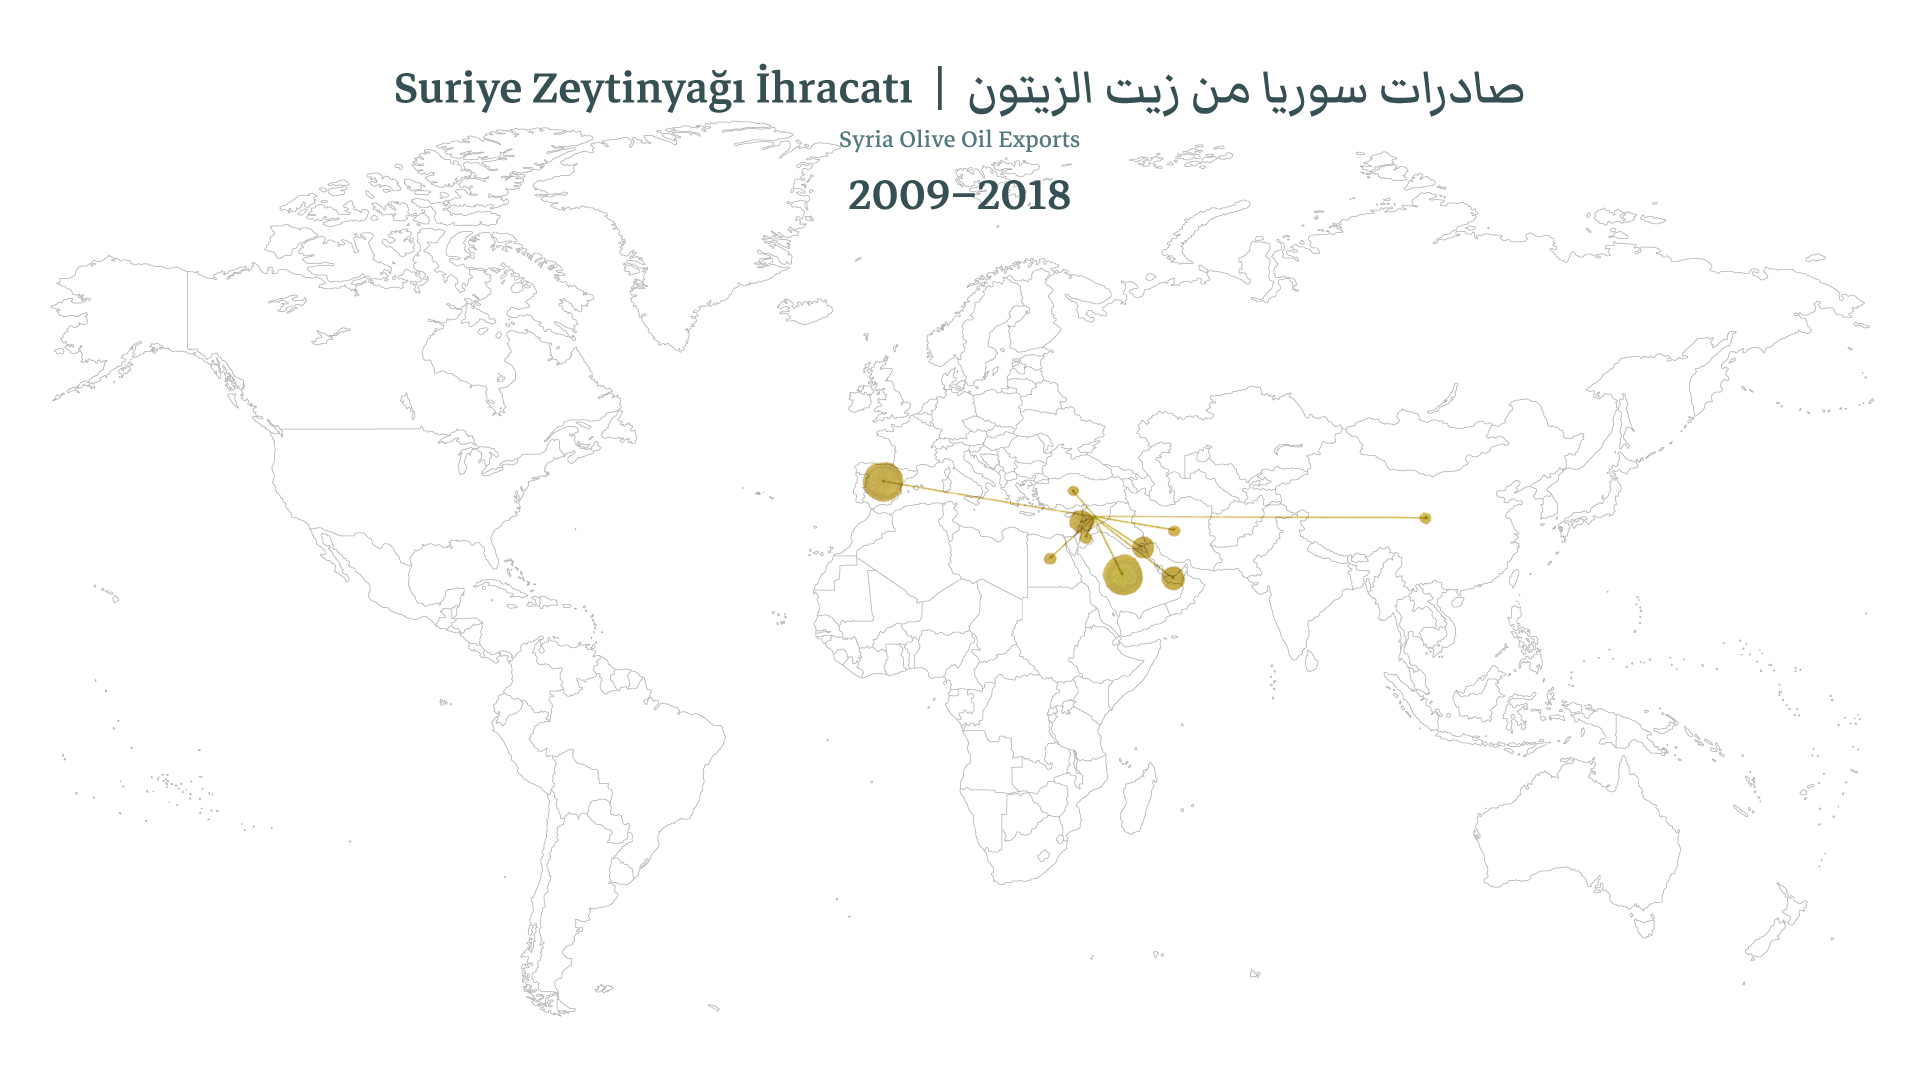
We also wanted to take a look at how Syria’s top-10 export destinations have changed with the war and its ongoing impact in olive cultivation in Syria, by comparing two 10-year periods, 1999–2008 and 2009–2018.2 (Note the change in Italy as a registered export destination.)
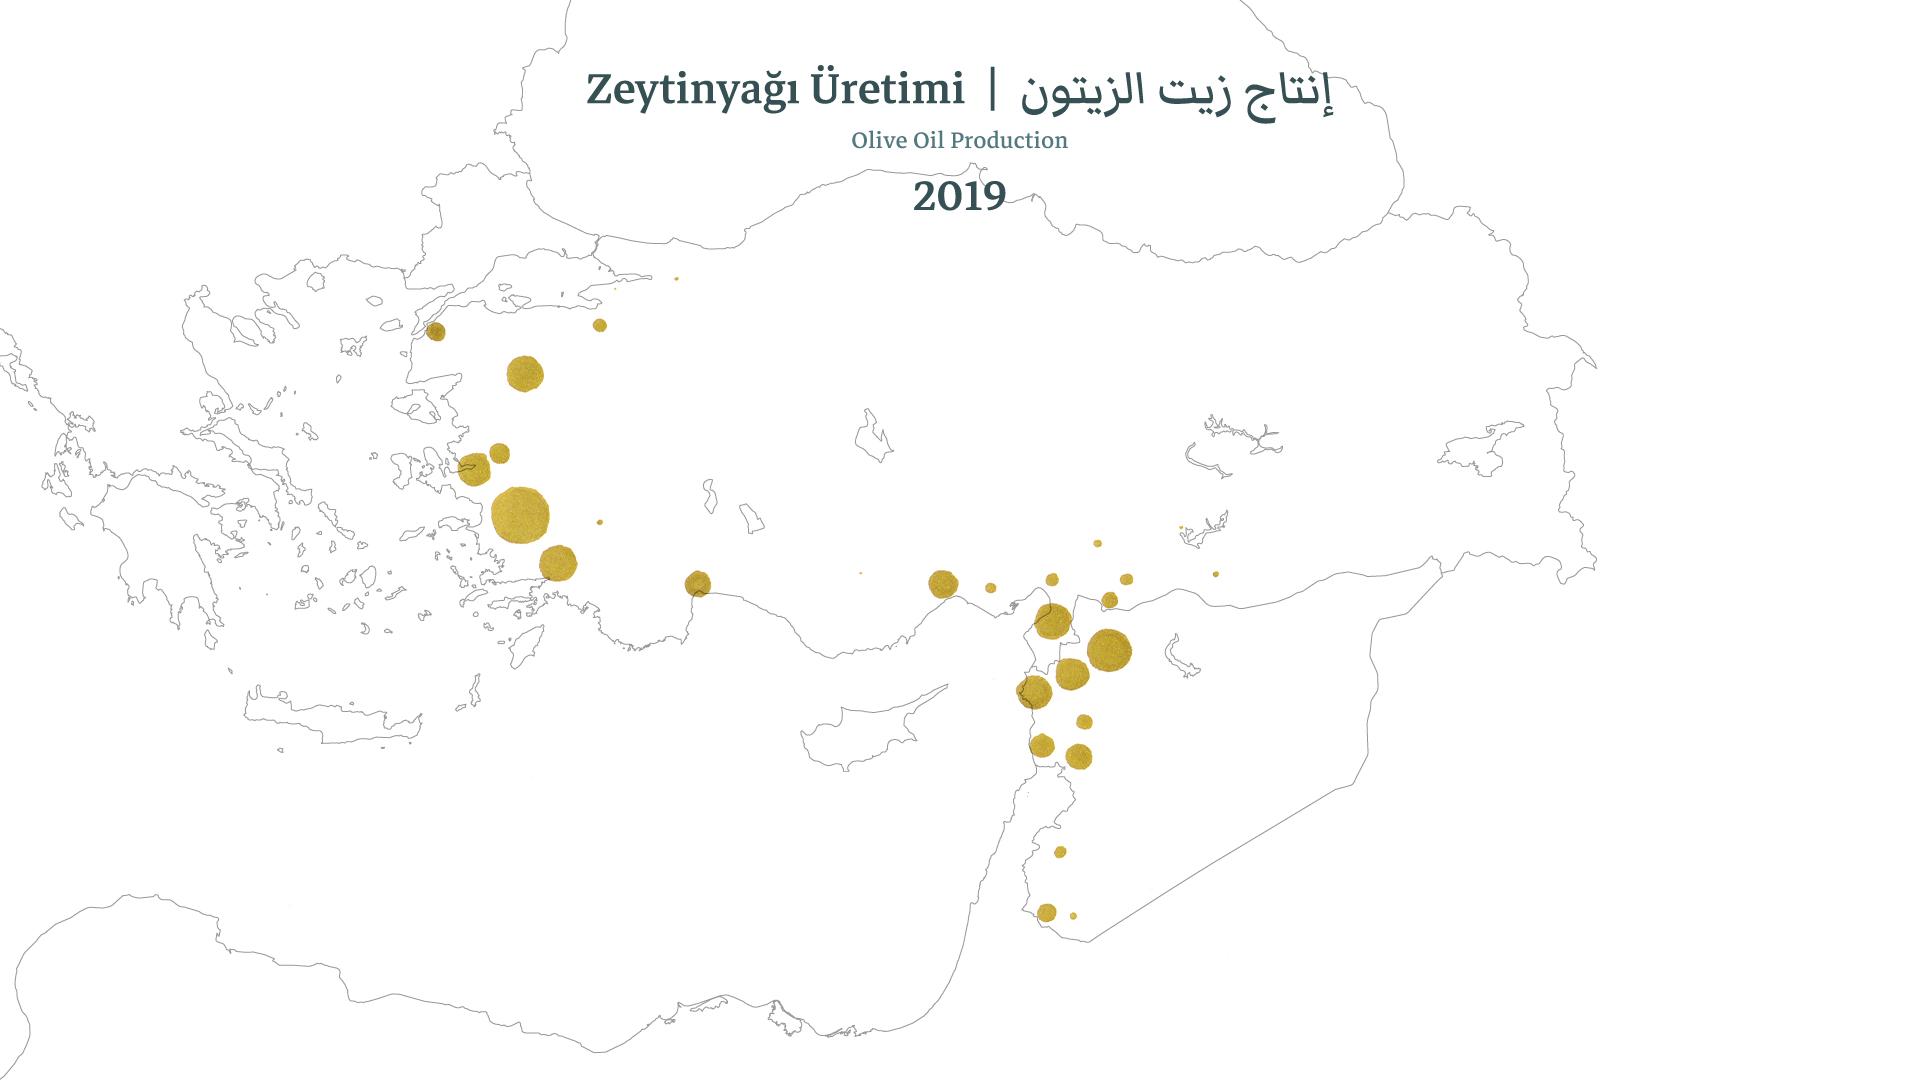
Here we displayed Turkey’s and Syria’s olive oil production in 2019 by city.3,4
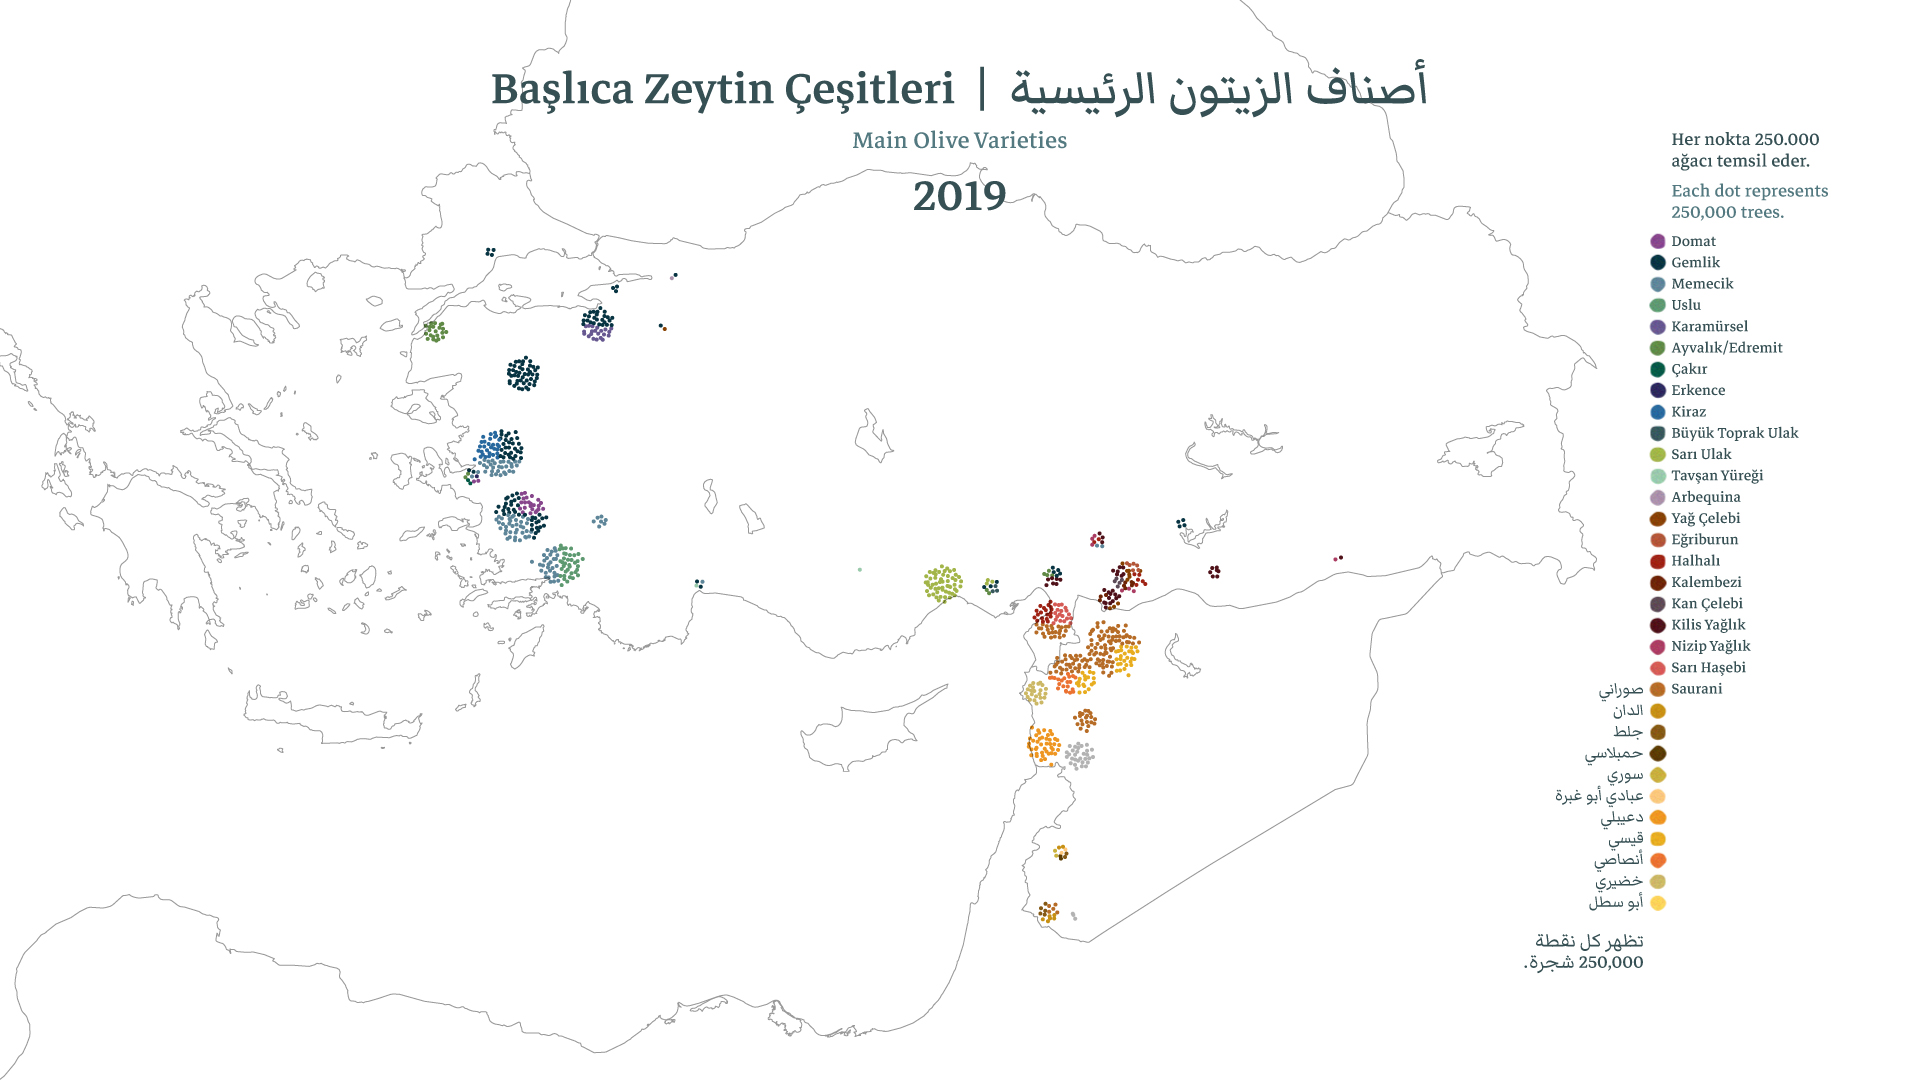
But the existence of olive oil production in a city doesn’t necessarily mean that the olives are cultivated in that city; it just points to the olive oil processing facilities and their capacities. Therefore we looked at the olive tree numbers by city, also showing the main varieties by color.3,4,5,6,7,8,9
Some notes of caution: The information we were able to find was the types of varieties in a city and the total number of olive trees, so the visualization of the distribution of those varieties within the city (the numbers and the positions of colors within a cluster of dots on a given city) isn’t based on data. Our purpose with this graph was to show (1) that there is a great richness of olive varieties in this region, and (2) that West Turkey, South East Turkey, and Syria have different groups of these varieties. That’s what we can do in a video in a few seconds of screen time, and that’s why I wasn’t bothered by the fact that the method of color-coding doesn’t fully work with this many colors – I don’t expect any viewer to read the legend and map the colors one by one in this situation. (That’s a good example of what I meant when I wrote that the medium affected many decisions; if this graphic was to be designed for a static medium and I wanted it to be fully decipherable, I would have chosen different methods.)
Note that I set a threshold of visibility for 250,000 trees when I chose the unit for a dot. There are many other olive tree populations (in North East Turkey, for example) that are not visible on this map because they are rather small.
In addition, there are conflicts in the reported data among printed and verbal sources, revealed in our correspondence with experts during the process. We chose to create our graphics based on what we found in the published resources mentioned at the end of this post.
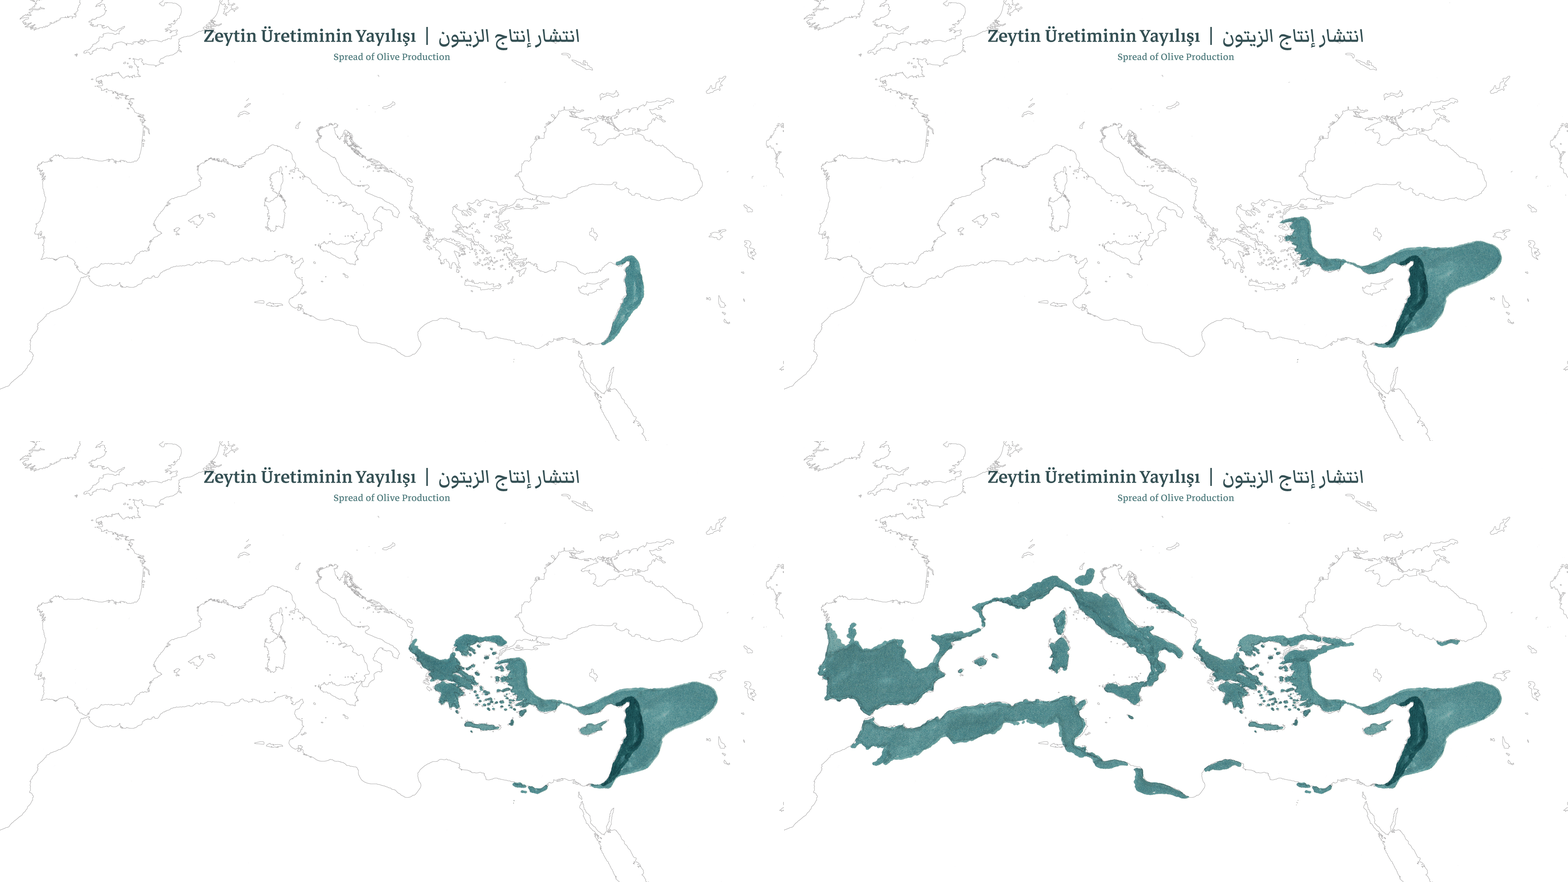
Lastly, I recreated the maps showing the spread of olive production since 4000 BCE 10,11 as mentioned by the archaeologist in the video, in our visual style. Together with the first set of graphs, they tell us that Syria and Turkey are the cradle of olive historically but have fallen behind in contemporary olive cultivation and production.
I thank my collaborators Merve Bedir, Damla Deniz Cengiz, and Hassan Chamoun; Zeynep Delen and Mücahit Taha Özkaya for providing us with great resources, comments, and questions; and Onur Yazıcıgil for answering my questions about Arabic typesetting.
Please refer to the graphics as courtesy of Deniz Cem Önduygu and Mutfak مطبخ Workshop, and together with this blogpost.

References
- FAO, Food and Agriculture Organisation of the United Nations, http://www.fao.org/faostat
- OEC, Observatory of Economic Complexity, https://oec.world
- Tarımsal Ekonomi Ekonomi ve Politika Geliştirme Enstitüsü, ‘2020 yılı Tarım Ürünleri Piyasaları Raporu’
- Syrian Economic Forum (2016) ‘Will the Syrian Olive Oil Return to Exportation Again?’
- Ulusal Zeytin ve Zeytinyağı Konseyi, ‘2019-2020 Üretim Sezonu Sofralık Zeytin ve Zeytinyağı Rekoltesi Ulusal Resmi Tespit Heyeti Raporu’
- Ümmühan Tibet, ‘Türkiye Zeytin Çeşitleri’, Ulusal Zeytin ve Zeytinyağı Konseyi
- A. El Ibrahem, et al. (2007) ‘The olive oil sector in Syria’ Bari : CIHEAM, 2007. p. 17-34
- G. Jbara, et al. (2010) ‘Fruit and oil characteristics of the main Syrian olive cultivars’ Italian Journal of Food Science. 4. 395-400.
- Syria Independent Monitoring (2018) ‘Understanding Market Drivers in Syria’
- Esnaf, Sanatkârlar ve Kooperatifçilik Genel Müdürlüğü, ‘2018 yılı Zeytin ve Zeytinyağı Raporu’
- J. M. H. Ighbareyeh, et.al. (2016) ‘Effect of bioclimate factors on olive (olea europaea l.) Yield: to increase the economy and maintaining food security in Palestine’ International Journal of Development Research V.06: I.12, pp.10648-10652

